> ## Documentation Index
> Fetch the complete documentation index at: https://docs.neuraltalk.ai/llms.txt
> Use this file to discover all available pages before exploring further.
# 📊 Analytics
> Complete guide to monitoring and analyzing your chatbot performance
🎥 Refer to the setup video for a step-by-step visual guide:
## Overview
The **Analytics** feature provides powerful insights into how your chatbot is performing. It helps you track conversations, measure engagement, analyze chat quality, and understand user behavior through interactive graphs and key performance metrics.
This guide explains how to view analytics data, apply date filters, export reports, and interpret analytics sections.
## Accessing Analytics
* Log in to your dashboard
* Navigate to **Logs and Tracking** from the main menu
* Click on **Analytics** in the left sidebar
* The Analytics page loads with charts and performance metrics
* By default, data is shown for **Today**
## Analytics Interface Overview
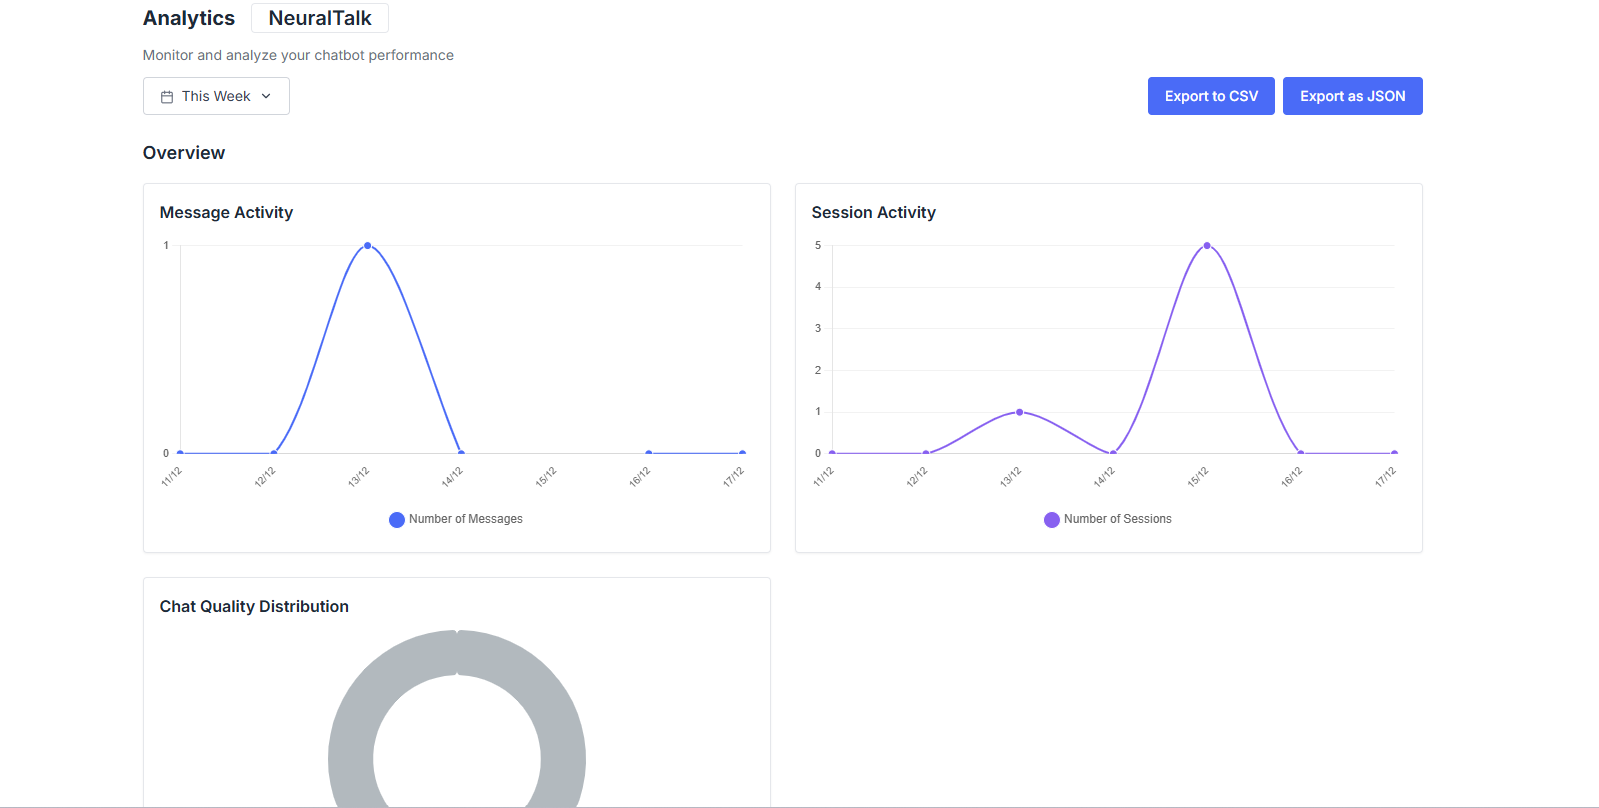
The Analytics dashboard is organized into multiple sections to give a complete view of chatbot performance.
### Date Range Filters
Use the date selector at the top of the page to filter analytics data.
* **Quick Date Filters**
* **Custom Range**
## Exporting Analytics Data
You can export analytics data for reporting or further analysis.
Download analytics data in CSV format for spreadsheets and reports.
Export raw analytics data in JSON format for technical analysis or integrations.
***
## Analytics Sections
### Overview Metrics
The **Overview** section displays key performance indicators at a glance.
* **Total Sessions**: Total number of chat conversations during the selected time period.
* **Total Messages**: Total number of messages exchanged between users and the chatbot.
* **Message Credits Used**: Number of message credits consumed in the selected time range.
* **Avg. Messages per Session**: Average number of messages in each chat session.
### Message Activity
The **Message Activity** graph shows message volume over time.
* Message count trends
* Peak usage times
* Daily or hourly activity patterns
Helps you understand user engagement and chatbot usage patterns.
### Session Activity
The **Session Activity** graph tracks chatbot sessions over time.
* Number of chat sessions
* Growth or decline in usage
* Engagement trends
Indicates how often users start conversations with your chatbot.
### Chat Quality Distribution
This section classifies conversations based on quality.
Conversations with positive engagement or successful outcomes.
Conversations with average or mixed engagement.
Conversations where the chatbot may not have met user expectations.
## Best Practices
* Monitor analytics regularly to track chatbot performance
* Use message and session trends to identify peak usage
* Review chat quality to improve responses and training
* Export data for deeper analysis and reporting
## Next Steps
View and manage human support requests
Manage live chat sessions and provide real-time support
 ## Analytics Interface Overview
The Analytics dashboard is organized into multiple sections to give a complete view of chatbot performance.
### Date Range Filters
Use the date selector at the top of the page to filter analytics data.
* **Quick Date Filters**
* **Custom Range**
## Exporting Analytics Data
You can export analytics data for reporting or further analysis.
## Analytics Interface Overview
The Analytics dashboard is organized into multiple sections to give a complete view of chatbot performance.
### Date Range Filters
Use the date selector at the top of the page to filter analytics data.
* **Quick Date Filters**
* **Custom Range**
## Exporting Analytics Data
You can export analytics data for reporting or further analysis.